About the researchers
This activity was run by Max Anderson-Loake, Angus Phillips and Joe Benton. They are Oxford students in the StatML CDT cohort that started in 2021. Max is most interested in Applied Statistics, and his DPhil project involves modelling the impact of natural hazards such as earthquakes. Angus works on machine learning approaches for a type of inference problem known as filtering. Joe is studying generative modelling and deep learning methods. Outside of their studies, Max enjoys open-water swimming, Angus is a champion cyclist, and Joe somehow finds pleasure in long-distance running.
Overview
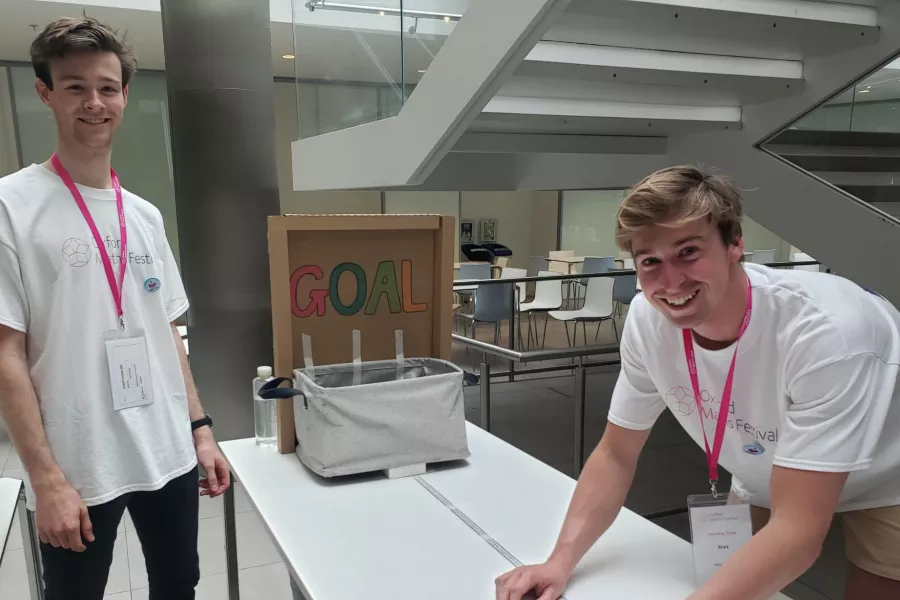
At the 2022 Maths Festival, we ran the activity ‘Catapult Correlation’. The activity involved two components:
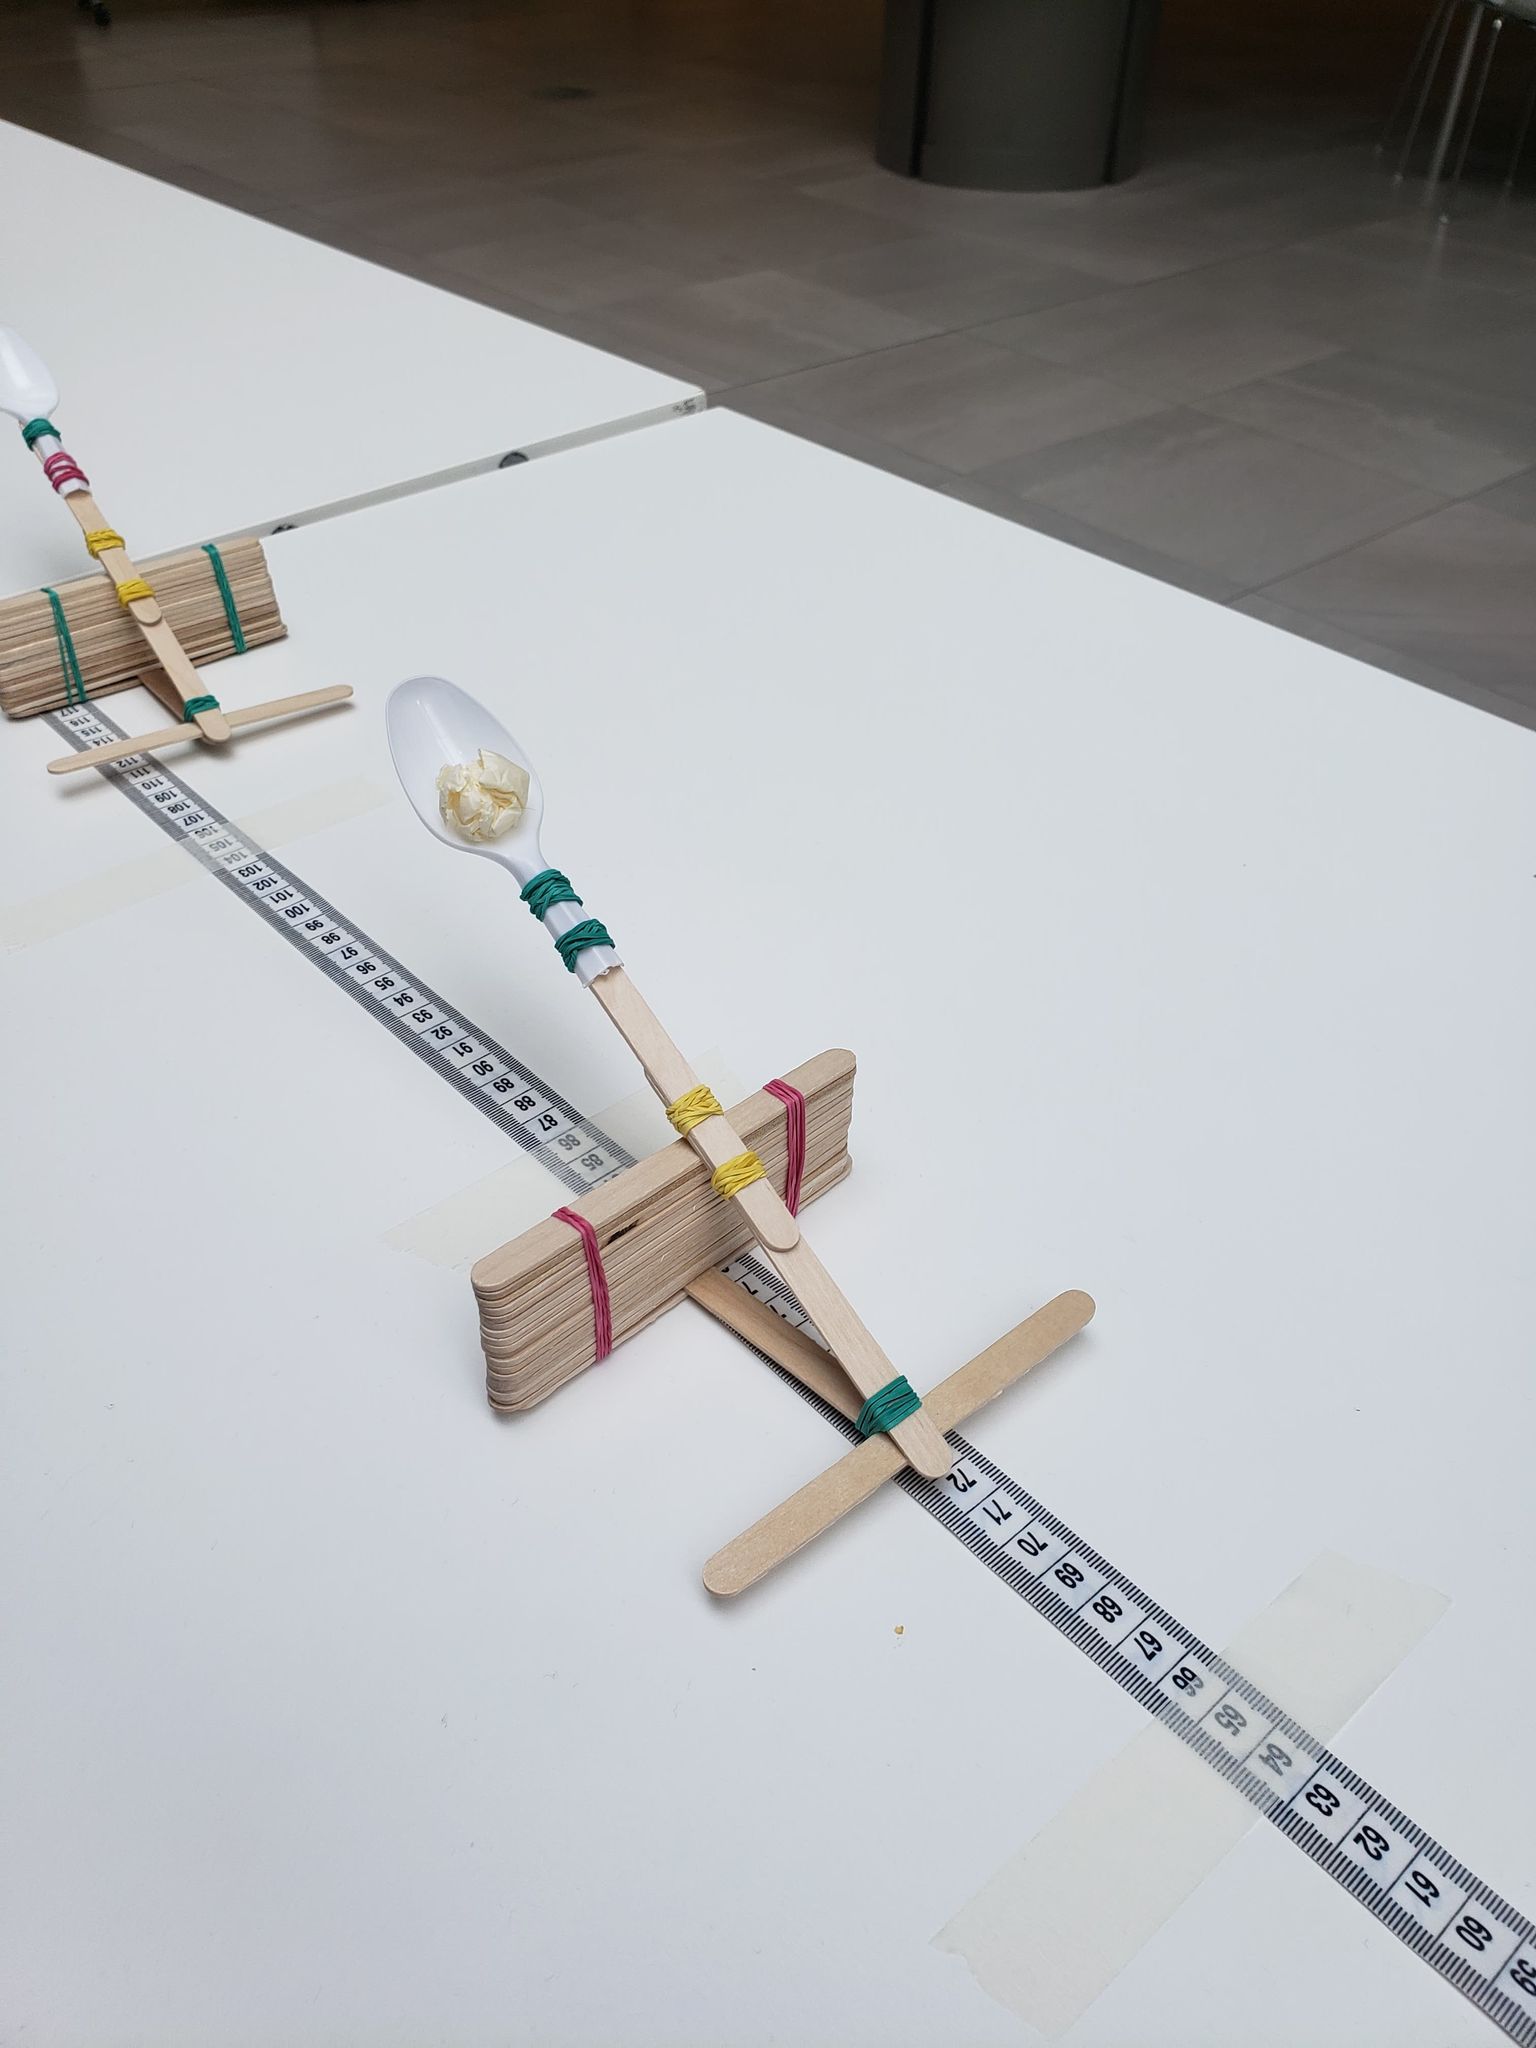
1. Students use a popstick catapult to fire five shots at a target from a chosen distance
2. Students plot their result on a graph depicting distance vs number of goals scored
The catapult was built following the instructions at: https://buggyandbuddy.com/stem-activity-for-kids-popsicle-stick-catapults/. We adapted the design by using a higher stack of popsticks, connecting two popsticks for the catapult lever, and adding a perpendicular popstick at the base to prevent the elastic band from sliding off.
Who was this activity aimed at?
Children ages 5-10 attending a Maths Festival with their parents.
What were the aims of the activity?
We wanted to show that:
- Anyone can conduct fun mathematical experiments.
- It's possible to collect data and display this in a way that makes it easier to see what's happening (i.e. it's harder to score when you're further away)
We also wanted participants to thinking about fitting models to data and making predictions (i.e. asking them how they might predict how many attempts it would take to score).
What went well?
• A key strength of the activity was that it was split into a ‘fun’ component (the catapult) and a ‘learning’ component (the graphing). We found that the engagement in the fun component carried through to the learning component, as the students were now interested in the activity. Parents and kids also were cheering when goals were scored, which attracted more participants.
• Amassing data through the course of the day encouraged students to return and look at the whiteboard. It also gave students the feeling that they were part of a larger experiment, and therefore contributing to something bigger.
• There were a number of learning outcomes that we could tailor to the abilities of the students. For younger students, the goal was simply for them to plot their point, and maybe think about an overall trend. For older students, we could discuss data noisiness, potential biases incurred by missing data, and ask them to make predictions.
• The activity used everyday materials – elastic bands, popsticks, plastic spoons, a laundry basket and a piece of cardboard. This demonstrated that maths experiments are accessible for everyone, and don’t necessarily need fancy equipment.
• Having 2 – 3 people running the stall allowed for one person to be at the catapult table and one to be at the graphing table. This allowed us to move through participants relatively quickly, and therefore maintain momentum.
What have you learned?
• The catapults were relatively flimsy. A few very young participants therefore struggled to fire the catapult without bending the spoon back on itself. We therefore frequently needed to replace the spoons.
• The trend between distance and goals scored was very noisy. If the catapults were slightly more robust and fired the balls in a straight line, there would have been a clearer trend. We also often let students have more than five attempts so that they could score, which introduced bias into the data.
