BNPgraph package: demo_degree
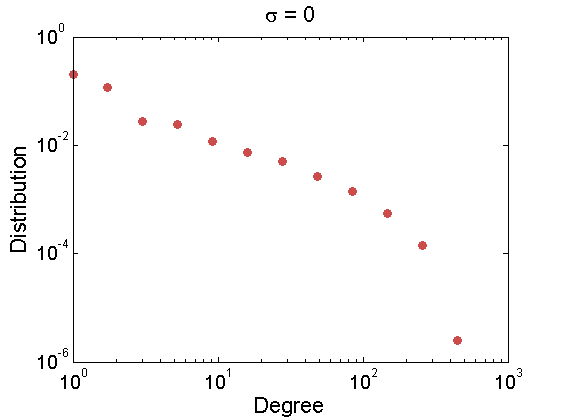
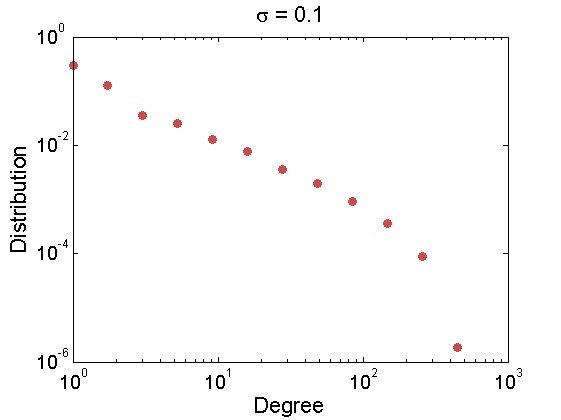
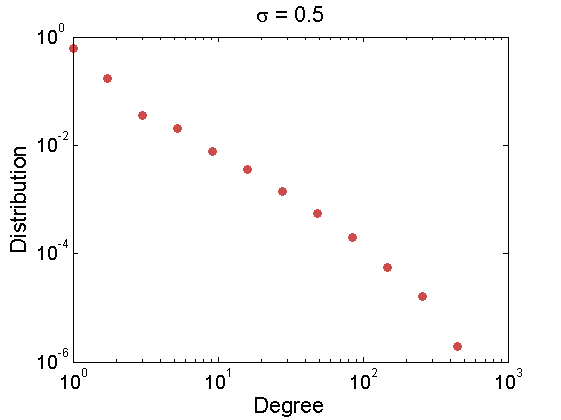
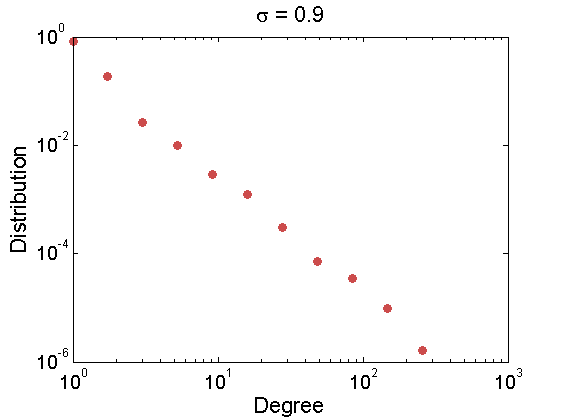
This Matlab script illustrates how the degree distribution varies with the parameter sigma in the GGP graph model.
For downloading the package and information on installation, visit the BNPgraph webpage.
Reference: F. Caron and E.B. Fox. Sparse graphs using exchangeable random measures. arXiv:1401.1137, 2014.
Author: François Caron, University of Oxford
Tested on Matlab R2014a.
Contents
General settings
clear all

% Add paths
addpath('./GGP/');
addpath('./utils/');

set(0,'DefaultAxesFontSize',14)
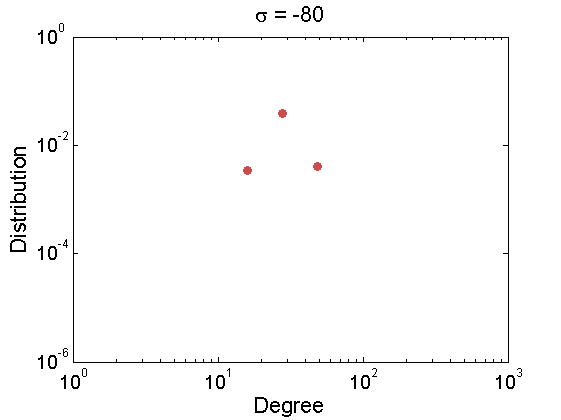
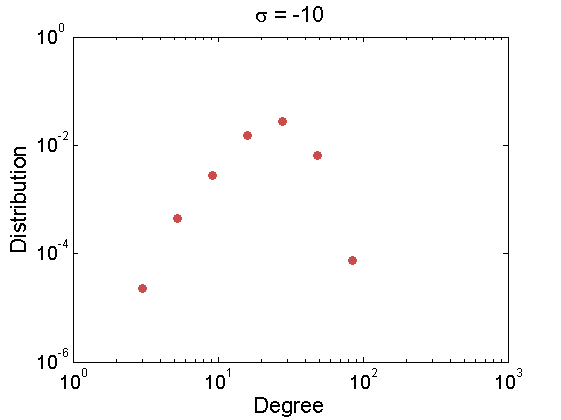
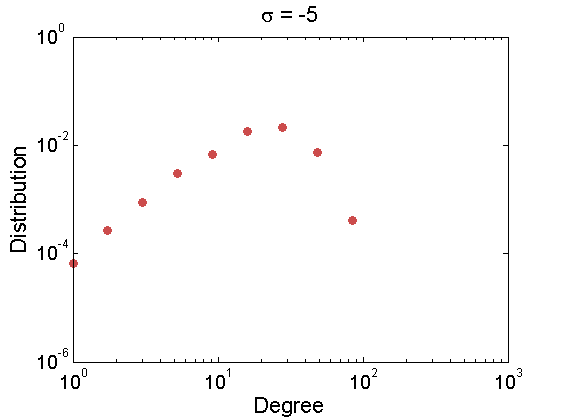
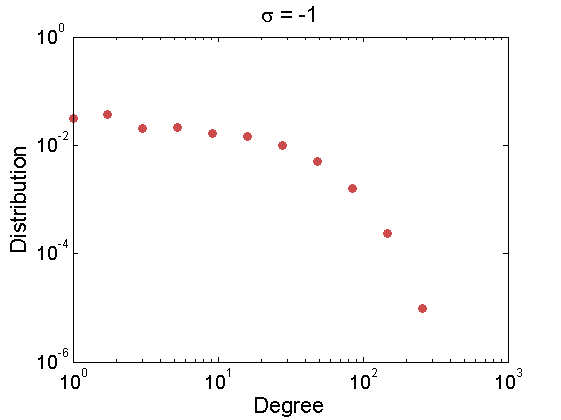
Degree distribution for various values of sigma
N = 20000;
p = .001;

sigma_all = [-80:5:-10 -9.5:.5:0 0.05:.05:.9];
tau = 1;
alpha = 100;
for k=1:length(sigma_all)
    sigma = sigma_all(k);
    if sigma<0
        tau = -sigma/sqrt(-log(1-p));
        alpha = -N*sigma*tau^(-sigma);
    else
        tau = 1;
        alpha = 200;
    end

    obj = graphmodel('GGP', alpha, sigma, tau);
    G = graphrnd(obj);
    h = plot_degree(G, 'o', .8);
    set(h, 'markersize', 6, 'color',  [.8, .3, .3],  'markerfacecolor', [.8, .3, .3])
    title(['\sigma = ', num2str(sigma)], 'fontsize', 16);
    xlim([0,1e3])
    ylim([1e-6, 1])
    switch(sigma)
        case {-80,-10, -5,-1,0,.1,.5}
            snapnow
    end
    pause(.5)
end