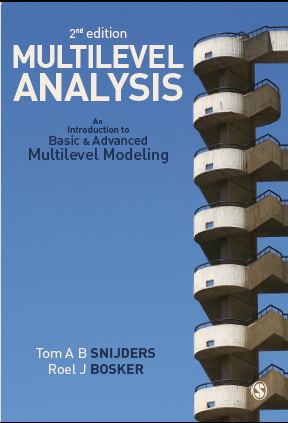
The second edition of the textbook, Multilevel Analysis: An introduction to basic and advanced multilevel modeling, written by Tom A.B. Snijders and Roel J. Bosker, appeared November 2011 at Sage Publishers. The official publication year, however, is 2012. The Sage announcement of this book is here, and here is the table of contents. The book was totally updated compared to the first edition, with new chapters on missing data, survey weights in multilevel analysis, and miscellaneous methods (Bayesian estimation, sandwich standard errors, latent class models). Each chapter (from 2 to 17) ends with a glommary, which is a combination of a glossary and a summary, giving the main terms and an overview of the chapter. Here is a set of slides which can be used for teaching. This webpage contains:
|
![]() |
> mlbook_red <- read.table("mlbook2_r.dat", header=TRUE)For reading this file into other software, delete the top line but note that it contains the variable names.
obey mlbook2_r.obe
> mlbook_mm <- read.table("mlbook2_mm.dat", header=TRUE)For reading this file into other software, delete the top line but note that it contains the variable names.
obey mlbook2_bb.obeIf you wish to use this data file in other software, just delete the top and bottom text lines that contain the information for MLwiN.
obey mlbook2_b.obeIf you wish to use this data file in other software, just delete the top and bottom text lines that contain the information for MLwiN.
> mlbook_b <- read.table("mlbook2_b.dat", header=TRUE)
> level2 <- read.table("rel_level2.txt", header=TRUE)For reading this file into other software, delete the top line but note that it contains the variable names.
Note that you can download the files below in many browsers by right-clicking on the file, and choosing something like "save as".
HLM |
MLwiN |
R |
Mplus |
SAS |
Stata |
Chapter Title | |
Chapter 3 | CH3ex7.obe | Chap03_np.do | Statistical Treatment of Clustered Data | ||||
Chapter 4 | mlbook_hlm_chapter4.zip | CH4568.obe | ch45.r | chap4.do | The Random Intercept Model | ||
Chapter 5 | mlbook_hlm_chapter5.zip | CH4568.obe | ch45.r | chap5.do | The Hierarchical Linear Model | ||
Chapter 6 | mlbook_hlm_chapter6.zip | CH4568.obe | ch6.r | chap6.do | Testing and Model Specification | ||
Chapter 7 | How much does the model explain? | ||||||
Chapter 8 | mlbook_hlm_chapter8.zip | CH4568.obe | ch8.r | chap8.do | Heteroscedasticity | ||
Chapter 9 | ch9.r | chap9.do | Missing Data | ||||
Chapter 10 |
ch10.obe ch10_infl.obe |
ch10.r | chap10.do | Assumptions of the Hierarchical Linear Model | |||
Chapter 11 | Designing Multilevel Studies | ||||||
Chapter 12 | chap12.do | Other Models and Methods | |||||
Chapter 13 | chap13.do | Imperfect Hierarchies | |||||
Chapter 14 | PISA.obe | pisa_b.R | chap14.do | Survey Weights | |||
Chapter 15 |
soep5560_21.obe Example15_12.obe |
ch_15.r | Longitudinal Data | ||||
Chapter 16 | CH16.obe | ch16.r | Multivariate Multilevel Models | ||||
Chapter 17 |
ch17.r ch17_ex6.r |
chap17.do Chap17A_np.do |
Discrete Dependent Variables |
Alastair H. Leyland, Peter P. Groenewegen, Multilevel Modelling for Public Health and Health Services Research
Although framed in the context of health-related research, it is also useful as a general introduction. The book has three extensive MLwiN tutorial chapters.
For these tests, there are the R packages ClusterRankTest and clusrank, both available from CRAN.
A paper contrasting the use of multilevel (hierarchical linear) models with methods that control in a simpler way for clustering of data, e.g., the sandwich estimator:
A different approach to latent class modeling:
Other R packages
A function to calculate the explained variance and residual intraclass-correlation (as treated in Section 17.4) for estimates obtained from ordinal is contained at the end of script ch17.r.
Several packages about imputation of missing data:
The text should be:
When comparing Tables 4.4 and 5.1, it can be concluded
that m1 - m0 = 2 parameters are added and the deviance diminishes
by D0 - D1 = 24888.02 - 24864.87 = 23.15.
Testing the value of 23.15 in Table 6.2 for p=1
yields p < 0.001.
Thus, the significance probability of the random slope for IQ in the model
of Table 5.1 is p < 0.001.
Materials Oxford Spring School, April 2012