Recently published research shows that members of regional communication networks form links based on how risky their exchanges with others may be: low-risk situations favor the creation of bridging structures that solve coordination problems, whereas high-risk situations lead to the establishment of bonding structures that make detection and punishment of defection more likely. This basic expectation has been tested in low-risk regional arenas, where indeed more bridging structures formed in time (Berardo and Scholz 2010). However, no empirical evidence on the formation of networks has been produced yet in high-risk social-ecological systems (HRSES). In this article, I study the network of communication among stakeholders in a small river basin in Argentina that has been subject to high levels of environmental stress over the last decades and empirically test whether more bonding structures tend to form in this high-risk SE system. Findings show that actors in the network have a tendency to create more triadic bonding structures, as expected. However, complementary results offer a more nuanced picture of how networks look like in highly-risky regional settings and caution against an overly optimistic view linking bonding in networks to the solution of collective action problems of a regional scale.
The issue of how to protect common-pool resources from overuse has occupied the minds of social scientists for many years. The path-breaking work of Ostrom and colleagues has improved our understanding of how the management of a wide range of natural resources can be optimized in complex social-ecological systems where multiple users interact with each other. Among the components of social-ecological systems that can help solve problems of overuse are the networks that form when social and political actors communicate with each other (Ostrom 2005, 2009). Communication networks contribute to the formation of social capital, which in turn lubricates social and political relations by increasing trust and trustworthiness (Bromiley and Cummings 1995; Sabatier et al. 2005), favoring the transmission of scarce resources among the components of a group (Agranoff and McGuire 2003), and in general producing the conditions that facilitate sustained cooperation among the members of a group (Scholz et al. 2008).
In a recent contribution to the study of this topic, Berardo and Scholz (2010) examined the formation and evolution of networks in 10 US estuaries, linking the formation of specific structures in the networks to the types of problems the actors faced and the risk associated with them. According to their “risk hypothesis”, actors may be embedded in high-risk or low-risk social-political environments, which in turn affects their network behavior (the types of social connections they make in their networks of communication). High-risk arenas, the argument goes, are mainly characterized by cooperation problems among stakeholders that negatively affect the sustainability of resources. The overuse of common-pool resources (CPRs) in Social-Ecological Systems (SES) is, of course, a classic example of such cooperation problems. The “risk hypothesis” anchors itself in the social capital literature, and predicts that in the presence of uncooperative behavior, actors are likely to create close knit, bonding communication structures because these structures facilitate the flow of redundant information that is more useful for detecting and punishing defection (Coleman 1988).
But low-risk can be prevalent as well in SES, since it is not always the case that actors face cooperation problems. Instead, in some instances actors predominantly face coordination problems, which take place when actors have roughly the same goals, but cannot quickly converge in a desired course of action to attain such goals. Different towns sharing a river, for instance, may independently arrive at the conclusion that they need to treat their wastewater to a high standard to prevent pollution of the waterway, but may also not be fully aware of each other’s strategies to achieve this goal. In situations of low-risk such as this, where stakeholders are “on the same page”, the “risk hypothesis” predicts that actors will create links that facilitate the emergence of bridging structures, which are more conducive to the flow of non-overlapping information that leads to finding innovative solutions to shared problems.
Berardo and Scholz showed that in the estuaries they analyzed actors had a tendency to form star-like, bridging structures where a central node had the potential to spread innovative information around the network, thereby solving underlying coordination problems. The authors claimed that this tendency was explained at least in part by the fact that the regional governance systems in the estuaries were slowly developing in the absence of acute environmental problems, which indicated that the risk of widespread defection was low. Their research design thus confirmed that low-risk situations are associated with the emergence of bridging structures in communication networks, but could not properly test whether high-risk situations are in fact associated with the creation of more bonding structures.
In this article, I address this issue by examining the network of communication among environmental stakeholders in the San Antonio river basin, located in central Argentina. This area is a High-Risk Social-Ecological System (from now on, HRSES) because it faces severe environmental problems that are the result of uncooperative (defective) behavior in the use of common pool resources in the area (as it will be described in detail in a later section).
Results will show that in this HRSES there is a tendency to the formation of bonding structures in the network, as expected by Berardo and Scholz’s “risk hypothesis”, but also that activity in the network is concentrated around highly central actors that can also fulfill a coordinating role. This last finding runs contrary to expectations because structures that indicate the presence of coordinators should be prevalent only in low-risk arenas. The combination of bonding and bridging structures that emerge in parallel is important because it suggests that self-organized communication networks might evolve in ways that facilitate the simultaneous solution of different types of problems. In this regard, the results provide further empirical support to the long-standing idea that governance subsystems in SES are inherently complex (Ostrom 2009), and that they can adapt to face challenges that unfold at an aggregate level beyond the control of individual actors (Lubell 2013).
Anderies et al. (2004) define an SES simply as the coupling of an ecological system and a social system, with the former containing biological or resource units and the latter being composed of social units. Extensive research in economics and political science in the last decades has shown that the collective action problems that occur in SES when myriad actors use resources are intensified when the systems are not contained in single, neatly defined political jurisdictions. Particularly in federal systems, the political fragmentation that characterizes many an SES is usually fertile ground for the emergence of institutional collective action (ICA) dilemmas that intensify environmental problems and imperil the chances of sustained collaboration among stakeholders (Feiock 2009; Feiock and Scholz 2010).
ICA dilemmas usually appear in fragmented systems when stakeholders free-ride on each other’s efforts to protect a resource or provide a certain service, which is likely to trigger non-cooperative strategies as actors try to avoid the “sucker” label that comes from cooperating in the face of defection (Feiock 2013). Fragmentation in an SES is thus risky because defective behavior can quickly spread, negatively affecting the ecological balance of the system.
Fortunately, a long tradition of research has shown that defective behavior in the use of resources can be prevented. One of the key variables to understand how the governance subsystem of a SES may contribute to reducing the risk of defection is the exchange of information that takes place in communication networks of stakeholders (Ostrom 2009). Recently published research has made an initial attempt at explaining how these communication networks may be shaped by the risky environments in which actors participate. Berardo and Scholz (2010) described the evolution of communication networks between policy actors in 10 US estuaries and argued that networks adopted particular shapes based on the risks their members faced. Their “risk hypothesis” states that actors facing risky situations where defection is likely should build bonding relationships that facilitate the flow of redundant, overlapping information among their group of contacts. This type of information can be useful for detecting and punishing defective behavior. Thus, the emergence of this type of bonding capital strengthens the likelihood of observing cooperative behavior, particularly if it can be sustained in time (Burt 2005; Coleman 1988; Putnam 1993).
Berardo and Scholz used two different types of network structures to illustrate bonding, as shown in Figure 1.
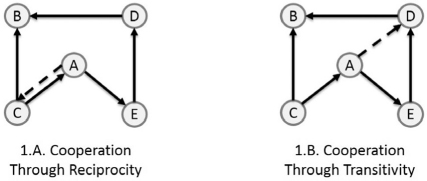
In Figure 1, a solid arrow pointing from an actor (ego) to another one (alter) means that the ego requests information from the alter, whereas a dotted arrow represents a choice of ego to build a tie based on the existing ties (the solid arrows). Panel 1.A represents the choice of ego A to build a tie to C that reciprocates an already existing tie that goes from C to A. A reciprocated link signals that both actors in the dyad have decided to engage in a stronger relationship with each other, which lowers the risk of mutual defection and enhances the likelihood of sustaining cooperation in time (Axelrod 1984). If it is true that the creation of bonding relationships is a response to the vulnerability that actors face in HRSES, then more reciprocal links should be created in these systems as time passes (i.e. as the network evolves), given that they are the building blocks upon which cooperative reputations are built.
H1. In a HRSES, actors will show a propensity to create reciprocal ties in their communication networks.
The second type of bonding structure in Figure 1.B that would be formed by the dotted arrow is the transitive triad, which indicates bonding beyond the simpler case of the reciprocal dyad. In a triad composed by actors A, E, and D, A can decide to create a link to D based on both its existing relationship with E, and the existing relationship between E and D. Building a tie to “a friend of a friend” provides the redundant information that is the staple of bonding capital, and discourages defective behavior since the reputational costs of such defection grow as information is more readily available to members of the group (Burt 2005; Putnam 1993).
Because in a transitive triad information may flow both directly and indirectly to a node that builds it, this particular structural configuration reinforces its monitoring capabilities. In this narrow sense, a transitive triad is a stronger form of bonding when compared to a simpler reciprocal dyad, where information flows only between two nodes.
H2. In a HRSES, actors will show a propensity to create transitive triads in their communication networks
The previous two hypotheses contain the expectations of observing more bonding capital configurations emerging when there are high levels of risk in social ecological systems. When levels of risk are low, however, the “risk hypothesis” predicts that networks will be configured differently. When actors face lower risks, the type of network structures they form should be different because defection is unlikely and actors may have a greater interest in working together to improve the sustainability of common-pool resources. In these cases, the reasoning goes, actors are less likely to form bonding configurations that are better to detect and punish defective behavior, and instead they should build configurations that are more conducive to the transmission of new, non-overlapping information (Burt 2005; Granovetter 1985) required to solve the problem of coordinating the behavior of multiple stakeholders with similar interests.
Figure 2 shows two types of bridging capital structures that may help solving coordination problems, according to the ‘risk hypothesis’. Panel 2.A shows actor A creating an “open 2-path” to reach C through B, which gives A greater access to non-overlapping information. The main argument for the creation of an “open 2-path” here is that, faced with different choices of partners, A would prefer to create a tie to B because B gives A access to two sources of information (direct information from B and indirect information from C that B relays). Any other choices would reduce the benefits of bridging. For example, a tie to D would close the existing two-path A→E→D, which would then turn into a redundant transitive triad that is useful to contribute to the solution of cooperation problems but not coordination problems.
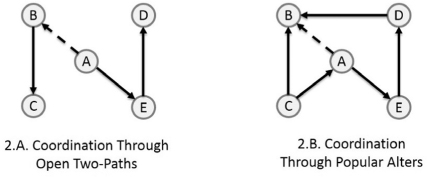
To reiterate the point, the tendency to create more bridging configurations should be observed in low risk SES. In a HRSES, the opposite should be true, as was explained before, with actors forming bonding structures. Thus, the following hypothesis follows.
H3. In a HRSES, actors will show a negative propensity to create open 2-paths in their communication networks.
The final structure tested by Berardo and Scholz was the “popular alter” configuration in Figure 2.A. When actors face coordination problems, they tend to identify other nodes in the network that seem to be comparatively well-endowed with information. Usually, more popular (or central) actors have the largest amount of information available at their disposal, thus being able to fulfill a coordination role. The importance of popular organizations with bridging capacity in ecosystem management has been duly examined in research showing that they help identifying common goals and interests and collaborative activities that lead the improvement in the management of shared natural resources (Folke et al. 2005; Wondolleck and Yaffee 2000).
In Figure 2.B, the most popular actor in the network is B, who is already contacted by two other nodes (D and C). Thus the expectation is that in low risk SES node A would build a tie to B, provided that the main problem in the SE system was one of coordination instead of cooperation. In a HRSES, where cooperation problems predominate instead of coordination problems, the expectation is just the opposite.
H4. In a HRSES, actors will show a negative propensity to create ties to popular alters in their communication networks.
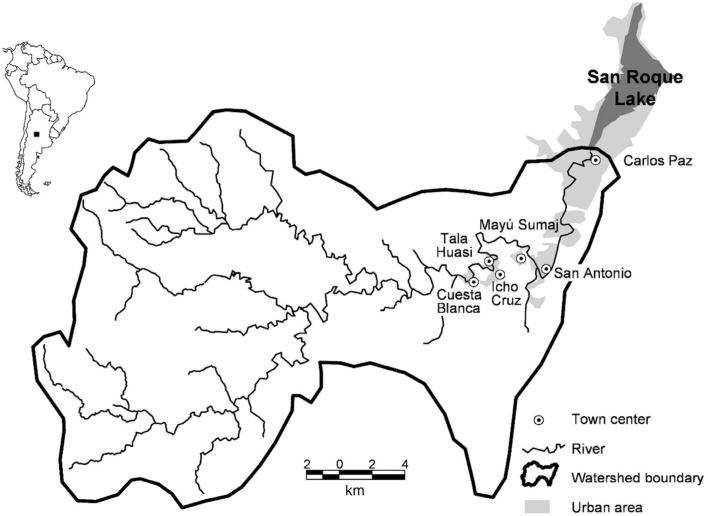
I test the hypotheses outlined in the previous section with data collected in 2010 and 2011 in the communication network formed by stakeholders in the San Antonio river basin in the province of Córdoba, in central Argentina. The basin covers an area of approximately 500 km2 and drains into the multipurpose San Roque reservoir, which generates hydroelectricity and provides drinkable water for the city of Córdoba (population 1.3 million and located about 30 kilometers downstream from the reservoir’s dam). The basin is located in a semi-arid region, with average annual rainfall mounting to about 1000 millimeters in its western section and about 750 millimeters in the eastern area.
As shown in Figure 3, there are six local communities located along the river in the lower section of the basin in a short 15-kilometer segment: Cuesta Blanca, Mayu Sumaj, Tala Huasi, Icho Cruz, San Antonio de Arredondo, and Villa Carlos Paz. The first three towns are smaller in size while the last three are bigger (Villa Carlos Paz is the largest by a good margin with a population estimated between 70,000 and 80,000). All six of them use the river as the main source of drinking water and often face water shortages, particularly in the driest months of the year. Historically, environmental regulations in the area have been extremely weak. Only recently have local governments started to better regulate practices that affect the use of, and access to, common pool resources such as public land and water resources. Nevertheless, enforcement of these rules remains feeble at best, mainly because the monitoring capabilities of local governments tend to be poor.
San Antonio river basin.
This weak institutional landscape helps explain the precarious ecological state of the basin, which has steadily worsened in the past years as economic activities develop that negatively affect the sustainability of natural resources in the area. Cingolani et al. (2008), for instance, show that the land cover in parts of the basin has been modified sharply as a result of both the harvesting of exotic pine tree species for commercial purposes and the production of domestic livestock that contributes to land erosion and negatively affects water quality. Residues from wild fires (a seasonal problem in the region) and the improper treatment of sewage in the different towns are other factors that negatively affect water quality in the river and the San Roque reservoir, a eutrophic water body (Amé et al. 2003; Ruibal Conti et al. 2005) where algae blooms are common (La Voz del Interior 2010,2011). Recent research even shows the presence of microcystins in the lake that frequently surpasses the guidelines suggested by the World Health Organization for drinking water and recreational exposure, and also of Anatoxin-a, a powerful neurotoxin that had not yet been identified elsewhere in South America and that should be considered “…a potential health hazard to humans, aquatic animals, livestock, and wildlife” (Ruiz et al. 2013, 15).
The situation is compounded by the unplanned urban growth that has been taking place in the basin for decades. Villa Carlos Paz, for example, has doubled in size in the last 20 years, but urban development in the other towns is accelerating as well. Research shows that current rates of water consumption per-capita in the area could lead to more severe water shortages in the future if not curved, even in the absence of further growth (Catalini and Garcia 2010). This state of affairs is generating political and social tension in the area (El Diario de Carlos Paz 2011). In the town of San Antonio de Arredondo, for instance, the decision of the local government to grant a permit to a developer to build 22 high-rise buildings in a legally established “nature reserve area” of about 140 acres was met in early 2013 with considerable opposition from a number of environmental NGOs and social movements who demanded a stop to what they saw as an out-of-control development push that will fundamentally alter natural landscapes. This ongoing dispute is likely to be replicated in the future in other parts of the basin, as concerns over environment-related topics tend to occupy a more central place in the agendas of a larger number of non-governmental actors.
In general, stakeholders in the area acknowledge the gravity of these problems. The survey that was used to collect data for this article (described in more detail in the following section) included a question that asked: “in general, how would you rate the environmental state of the basin in a scale ranging from 0 to 10, where 0 means that the basin is in a very poor shape from an environmental standpoint and 10 means that the basin is in excellent shape from an environmental standpoint.” In the first wave of data collection, which took place in 2010, the mean value was 2.83 (with a standard deviation (s.d) of 1.40). In the second wave of data collection (2011), the mean value of responses increases, but only slightly to 3.18 (s.d. 1.55).
Summing up, the environmental problems in the San Antonio river basin, coupled with the social conflict that has emerged in the last decade as a response to what are perceived as insufficient efforts to promote the sustainable use of resources, make the San Antonio river basin a good example of a Social-Ecological System characterized by high systemic risk, or HRSES. According to the “risk hypothesis” (Berardo and Scholz 2010), and given that a HRSES is characterized by an abundance of cooperation problems, one would expect to observe the emergence of bonding structures in the stakeholders’ communication network, as described in hypotheses 1 and 2, which serve to transfer information that makes it easier to detect and punish behavior that can intensify environmental problems.
Between February and April of 2010, I developed a search protocol to identify relevant stakeholders in the basin from web documents and stories appearing in the previous 24 months in both the main newspapers in the city of Cordoba and the local newspapers in the towns located in the basin. The identification of stakeholders was accomplished by obtaining the names of individuals and organizations that appeared in stories selected based on a combination of relevant keywords (“water quality”, “land use”, “biodiversity”, etc.) paired with the names of the towns in the San Antonio river basin. The process rendered the names of 48 individuals to interview, some of whom worked for the same organization (their responses were later aggregated, as described below). Starting in October of 2010, these individuals were asked to fill an online survey, which 40 of them did (83% response rate).
The survey included the following name generator to map the network of communication: “Can you name the individuals or organizations from whom you have obtained information (legal, technical, or a different kind) in the last 12 months about environmental-related issues in the basin?” Responses to this question were used to map the network of communication, but also to collect identify stakeholders not present in the original list that was produced with the media search. Through this name generator I obtained the names of 18 new individuals who were also contacted and asked to answer the survey; nine of them did (50%). Overall then, 66 individuals were contacted, and 49 answered the survey (74% overall response rate).
The final step before mapping the communication network in the area was to aggregate names of individuals working for the same organization.[1] When this process was completed, the final tally of stakeholders (the nodes in the communication network) reached 59 (44 organizations and 15 individuals), with survey responses from 43 of them, for a response rate at the aggregated level of 73%.
The process was repeated between October and December of 2011 to obtain a second observation of the network, which is necessary to perform a longitudinal analysis of network evolution and properly test hypotheses 1 through 4. The first stage was to contact the 66 individuals that composed the full set of respondents in 2010 and ask them to fill the survey again. A total of 45 of them filled the survey (67% response date). In this case, using the name generator produced the names of 16 new individuals, 8 of whom answered the survey (response rate of 50% in the snowball). Overall, 82 individuals were contacted in 2011, and 53 answered the survey (65% overall response rate).
Like it was the case in 2010, the final step consisted in aggregating names of individuals working for the same organization. This process rendered a final count of 70 stakeholders (57 organizations and 13 individuals) that are part of the network, with survey responses from 57 of them, for a response rate at the aggregated level of 81%. According to Huisman (2009), the stability of most network measures is not threatened with a rate of missing data as low as the one I obtained in 2010 (about 27%) and 2011 (19%).
A graphical representation of the network in the two years is contained in the Figure 4.
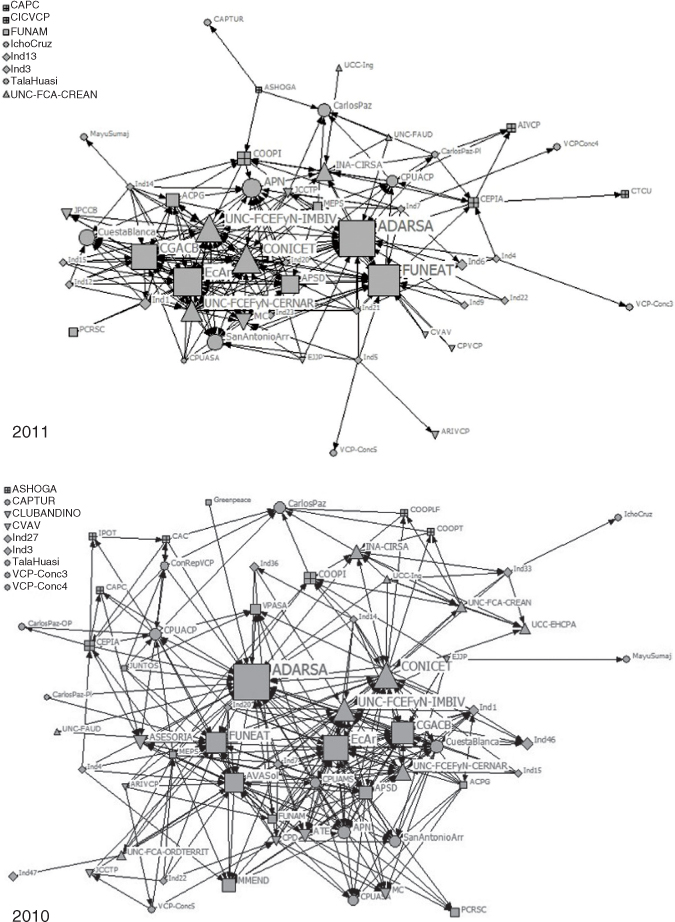
Nodes are sized by in-degree or number of incoming ties, and shaped by type. Square nodes are environmental NGOs, interest groups, or social movements that make the defense of the environment the centerpiece of their policy agendas. They include organizations such as Association of Friends of the San Antonio River (labeled ADARSA), Argentine Ecosystems (EcAr) and Foundation for Education and the Environment (FUNEAT). Circles are governmental actors and include town majors, city council members, and different local government offices that deal with environment-related issues. Up-pointing triangles are educational or research organizations, of which the most important are the National Council of Scientific and Technical Research (CONICET) and the Multidisciplinary Institute of Plant Biology at the National University of Cordoba (UNC-IMBIV). Crossed-squares are professional associations or business organizations, including the main water provider in the area – COOPI. Down-pointing triangles are other types of organizational actor. Finally, diamond-shape nodes are individuals (respondents that did not claim to represent an organization when they engaged in discussions related to the management of natural resources in the basin).
The network in 2010 has a density of 0.05, with an average degree of 4.20. In 2011, the network grows in size (there are more participants), but also in its density and average degree scores (0.06 and 4.84, respectively – see Table A1 in the Appendix for more information about the network). Most central actors in the network tend to be environmental NGOs, interest groups, or social movements, followed by some research and educational institutions. In the two networks, the nodes are also relatively clustered in a strong core, with many ties connecting them to each other. Governmental actors, on the other hand, remain scarcely connected. None of the six local governments in the area (Villa Carlos Paz, Mayu Sumaj, Cuesta Blanca, San Antonio de Arredondo, Icho Cruz, and Tala Huasi) obtains information about environmental-related issues from either of the other five. This fragmentation at the local level suggests that environmental problems in the basin are critically compounded by the lack of joint management efforts among actors with regulatory power in the area.
Descriptive statistics.
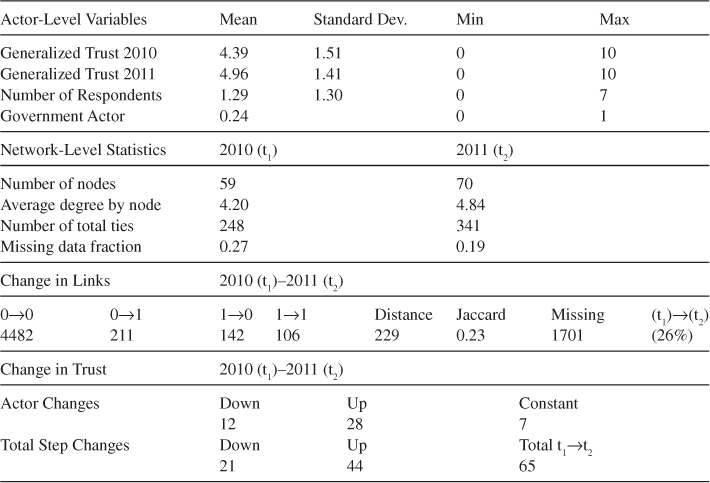
It is important to notice that even though the main actors in the network retain their relative importance from 2010 to 2011, the network experienced changes in its composition; 12 actors who were part of the network in 2010 had left it in 2011 (they claimed they were no longer active in the discussion environment-related issues when they were contacted in 2011), whereas 23 actors that were not present in 2010 joined the network in 2011.
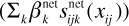
I test hypotheses 1 through 4 by estimating a stochastic actor-oriented model (SAOM) for network dynamics (Snijders et al. 2010). SAOMs can be used to model how actors in the network decide to create ties or destroy those that already exist. The model assumes that changes in ties reflect individual micro-adjustments (or “micro-steps”) that the actors make to improve their overall positions in the network. A SAOM models this process of “micro-steps” through the estimation of a network evaluation function which contains different terms, each of which represents the “attractiveness” of different network configurations for ego (the actor making the changes). In the case of the models estimated in this article, the function adopts the following form:

The first four terms represent the tendency of a node i to form the configurations contained in hypotheses 1 through 4, the fifth term represents other effects discussed below, and ɛnet is the stochastic error term in the function.
In more detail, the first term represents the preference of ego i for the formation of reciprocal ties: an edge xij (directed from i to j) is reciprocated by an edge xji (directed from j to i). The second term represents the preference for the formation of transitive triads in the network. These two first terms provide a test for the first two hypotheses, which link high risk to the formation of bonding capital in networks (reciprocity and transitivity). Thus it is expected that coefficients β1 and β2 will be positive.
The third and fourth terms, on the other hand, represent the tendency of ego to make choices that increase the number of actors at distance two that it can reach (hypothesis 3) and that connect it to alters that are popular in the sense that they are contacted by many other nodes (hypothesis 4); collectively these two terms represent the search for structures that increase bridging capital in the network, which according to the “risk hypothesis” should be prevalent in social ecological systems that are not subject to high risk. Given that the San Antonio river basin is a HRSES, however, the expectation is to observe negative coefficients for β3 and β4.
The last term in the equation
To test these expectations, they measured trust with the following question: “Thinking about the range of contacts you had with other stakeholders, how much do you completely trust these stakeholders to fulfill promises and obligations made in the context of the (estuary) partnership?” (0=“complete distrust” and 10=“complete trust”). In the San Antonio river, I asked an adapted version of this question, not mentioning “estuary partnership” but instead asking about promises and obligations in matters related to the management of natural resources in the basin (I used the same 0–10 scale). I then proceeded to include ego, alter, and ego-alter similarity effects in my model to replicate the original study.[3]
Berardo and Scholz also included ego, alter, and similarity effects for a dummy variable capturing whether nodes are governmental (value of 1) or nongovernmental (value of 0). Governmental actors in the US estuaries that they studied are usually endowed with greater organizational resources that can explain a higher level of activity in a network, and so they included these effects with the expectation that their coefficients would be positive and significant, meaning that governmental actors would be more active in creating ties and receiving them (and additionally, that governmental actors would show a propensity to interact with each other more). I include the same dummy variable in my model as well to test for these three effects.[4]
An advantage of SAOMs is that they allow for the estimation of the coevolving process through which actors modify their network ties and change their individual attributes. The examination of this coevolving process is accomplished through the estimation of both the network evaluation function presented in equation 1, and a behavioral evaluation function that estimates how the nodes change a given behavior or attitudinal trait (Steglich et al. 2010). Berardo and Scholz (2010) modeled the change in levels of trust with the following behavioral evaluation function, which I replicate with the San Antonio river basin data;

In this equation, the first term represents the linear tendency of trust to grow in time, while the second term controls for the effect of trust in 2010 on the changes that take place between 2010 and 2011. The third term is the average alter effect, defined as the product of ego’s trust multiplied by the average trust of her alters. A positive coefficient would indicate the presence of a social influence process, with ego’s trust growing in response to an increase in her alters’ average level of trust. The fourth term controls for the effect of the governmental actor dummy on the level of trust, which in the original study was hypothesized to be positive indicating that governmental actors may exhibit higher levels of trust than non-governmental ones. Finally, ɛbeh is the stochastic error term for the function.
To perform the estimation of both the network evaluation function and the behavioral evaluation function I used SIENA, a software that implements SAOMs for network data collected longitudinally. SIENA relies on a simulation-based estimator that treats data collected in 2010 and 2011 as snapshots of an underlying process in which changes in both network connections and levels of trust are assumed to reflect ongoing individual “micro-adjustments” made by the actors between the two moments when the data were collected.
The estimation of parameters is accomplished with a three-phase iterative stochastic simulation algorithm. During the first phase, the algorithm approximates the derivative matrix of observed network configurations (or “target statistics”) by parameters. The second phase progressively improves the value of the parameters through multiple simulations (4000 of them in this paper), with the goal of making the parameters more likely to produce statistics that equal those in the observed network. The final phase checks whether the average statistics obtained in the simulations of phase 2 are close to the target statistics. If this is indeed the case, the model is said to “converge” toward the observed statistics, which is represented by small t statistics for deviations from targets. Convergence is considered excellent when these t-rations are <0.1, representing very small deviations in the simulated statistics from the observed statistics (see Snijders et al. 2010 for more information about the estimation procedure).
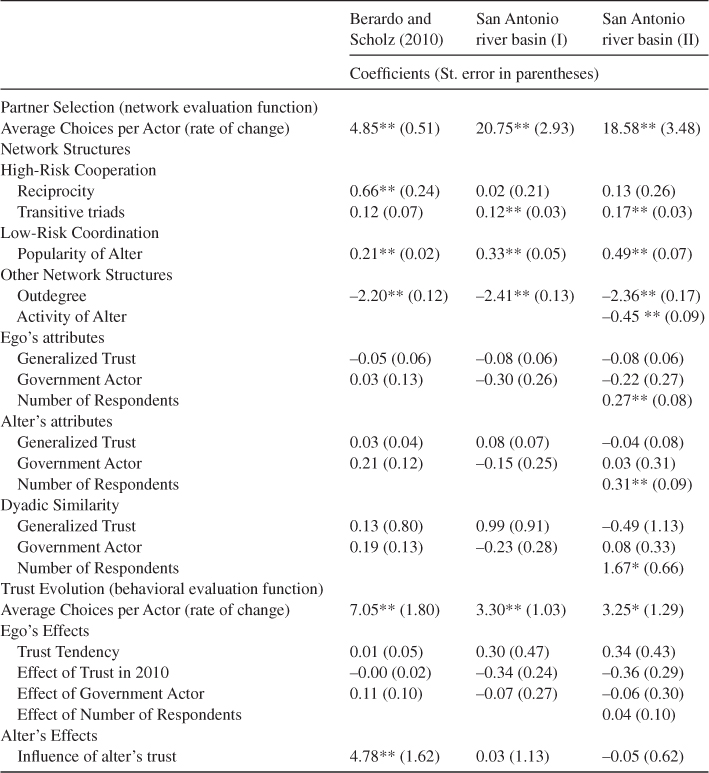
Table 1 presents the results of the estimation of the models, with coefficients representing log odds ratios of the probability that a tie that creates the configuration is chosen over an alternative state (no change in ties, or creation of a tie that contributes to the formation of another configuration). The estimations converged properly, with t values <0.1 for all the parameters.
Comparison of longitudinal analyses of self-organizing networks in US estuaries and the San Antonio river basin.
*p<0.05, **p<0.01 (2-tail). |
The table contains the results of the model in the Berardo and Scholz article in the left column, provided for comparison purposes. The middle column (model I) is the replication of the Berardo and Scholz model in the San Antonio River Basin. Finally, the rightmost column (model II) shows the results for an alternative model that includes four additional parameters. These four parameters were added after performing a “score-type test”, which helps identifying parameters that improve the fit of the model (Schweinberger 2012).[5] One parameters is added in the “other network structures” subsection in the table: Activity of Alter. This models the tendency of actors to create ties to alters that have many outgoing ties (high outdegree). The other three effects that are included in the fuller model are the ego, alter, and similarity effects for the variable number of respondents who are part of the node (organization). As explained before, when more than one respondent belong to the same organization, their responses were aggregated. Obviously, organizations represented by more respondents are more likely to have more edges in the network, both incoming and outgoing. The similarity effect is added to find out whether there is a tendency for larger organizations to interact with other organizations that are also comparatively large, as indicated by the number of respondents to the survey. The organizations with the larger representation in the surveys are environmental NGOs and Educational/Research Organization, and so a positive similarity effect would indicate collaboration between these two types of organizations.
Model II is the one with the better fit to the observed data, so I use the results in this model to test the hypotheses and draw conclusions about the evolution of the network of collaboration of stakeholders in the San Antonio river basin.
In general, the results of Model II in the San Antonio river basin, and those reported in Berardo and Scholz show networks that evolve in somewhat dissimilar ways. The first noticeable difference is in the size of the rate of change parameter (labeled “average choices per actor”), which models the speed at which actors may decide to create, maintain, or destroy links in the network. The value 4.85 in the 10 US estuaries studied by Berardo and Scholz indicates the average number of opportunities each actor had to change a tie between the two time periods they examined (not necessarily making that change though). In the San Antonio river basin this value is much higher (18.59), which is simply explained by the fact that there are sizeable changes in the network between the two observation points in terms of who participates, with some actors being active in 2010 but not 2011 and vice versa. This “instability” in the communication network gives actors a larger number of opportunities to make decisions about who to get in contact with, and this in turn is reflected in the rate parameter.[6]
Another difference is on the relationship between trust and network activity. Berardo and Scholz did not see any effect of trust on tie formation, but instead identified a “contagion” effect of network activity on trust, with actors increasing their levels of trust after the average level of trust of their alters grew. In the San Antonio basin this social influence effect is entirely absent. It is not easy to discern why, though a plausible explanation would be that links between actors are not stable or strong enough to facilitate something more than the simple exchange of information about environmental-related issues.
In regards to the coefficients for reciprocity, transitive triads, and popularity of alter, which serve to test the main hypotheses of this paper, there are subtle differences between the findings in the San Antonio basin and the 10 US estuaries studied by Berardo and Scholz, where actors did not show a tendency to build transitive triads, but instead had a preference for the simpler way of bonding represented by dyadic reciprocity. In the San Antonio river basin, this finding is reversed. Whereas actors do not seem to gravitate toward the reciprocation of ties, contrary to the prediction of hypothesis 1, they do in fact engage in building more transitive triads, which provides support for hypothesis 2.[7]
In general then, results show that actors in the San Antonio river basin have a tendency to create closed structures that facilitate the transmission of overlapping information that is thought to be a key ingredient to avoid defection in the long run. Moreover, the fact that they favor the creation of transitive triads over the simpler bonding structure of reciprocal dyads suggests that actors in general value (either explicitly or implicitly) the greater reassurance against multi-actor defection that transitivity provides and which reciprocity cannot offer (since an ego that creates a transitive triad receives direct information about the two other members but indirect information about one of them as well). This result provides further support for the “risk hypothesis”, which predicts that a tendency for the formation of transitive triads would be present in HRSES.
But this overall picture of high risk linked to the emergence of bonding capital becomes more nuanced once other effects are considered. According to hypothesis 4, the expectation in a HRSES is to observe fewer star-like structures with a popular actor fulfilling a coordination role. However, the coefficient for the “popular alter” effect in Table 1 is positive and statistically significant at the 0.01 level, which means that over time the actors in the network try to gather information from actors who are already very active in the role of providing information to others (but not in the role of seeking information from others, as indicated by the negative and significant “Activity of alter” coefficient). In other words, the bonding capital that is formed when transitive triads emerge in time is complemented with the formation of structures that are – ideally at least – conducive to the potential solution of coordination problems.
Interestingly, the coordination role is not fulfilled by governmental actors, who are not more active than non-governmental actors in the basin (neither the ego nor the alter effects are distinguishable from zero). In fact, a visual comparison of the network in 2010 and 2011 (see Figure 4) shows that the nodes that tend to be more central are usually either environmental NGOs, interest groups, or social movements (ADARSA, FUNEAT, Argentine Ecosystems, etc.), or educational or research organizations (CONICET and National University of Cordoba – UNC – to name a few). These are actors that are in general well-endowed with the capacity to generate and/or gather and communicate technical information that can be used to assess the depth of environmental problems in the basin and their potential solutions, and in this sense can help solving coordination problems.
In this paper I have offered a complementary test of the “risk hypothesis” (Berardo and Scholz 2010) in a HRSES, where multiple actors coexist in an area where environmental problems are inter-jurisdictional in nature. Studying how communication networks form and evolve among stakeholders is important because social interactions may have a critical effect on the likelihood of achieving the sustainable use of common pool resources (Ostrom 2009; Schneider et al. 2003; Scholz et al. 2008).
While the “risk hypothesis” includes clear expectations about the linkage between risk level and network configurations, the original article that proposed it did not provide a full test, since it focused on the analysis of networks that formed and evolved in relatively low-risk social ecological systems. Berardo and Scholz (2010) analyzed the networks in 10 US estuaries that were not subject to particularly acute environmental problems, and thus could not produce empirical evidence to demonstrate whether high-risk is in fact associated with network configurations that produce bonding capital.
The selection of the case studied in this paper was made purposely to address this shortcoming since the San Antonio river basin is a high-risk social-ecological system where environmental problems result from the excessively fragmented, non-coordinated behavior of both resource users and governmental authorities. The findings provide support for the basic expectation contained in the “risk hypothesis” that in highly-risky situations there is a tendency to observe triadic structures that favor bonding among actors, which produces overlapping information needed to prevent defection and trigger collaborative behavior. But they also show that actors have a tendency to search popular alters that can help solve coordination problems.
Of course, it is interesting and relevant from a practical standpoint to examine whether the existence of such structures actually leads to better management of common-pool resources through the solution of those types of problems. Unfortunately, it is not possible to achieve this goal without collecting more data, but considering the fact that the most central positions in the network are occupied by non-governmental actors at least warrants caution about the real chances in this system of finding quick solutions to coordination problems of a regional scale. The environmental NGOs, social movements, and educational/research organizations that occupy the central positions of leadership in this evolving network are actors with no capacity to impose regulations that can lead to a more sustainable management of common-pool resources in the area, and thus have limited power to exert enough pressure on the governance subsystem to force behavioral changes leading to the improvement of environmental conditions in the basin.
There is a final implication that is important from a theoretical standpoint. The fact that the creation of bonding structures coexist with the search of popular actors in the San Antonio river basin suggests that both coordination and cooperation problems are present in this HRSES. This finding suggests that the analytical separation made by Berardo and Scholz between high-risk/high-bonding versus low-risk/high-bridging SE systems may be too simplistic. Better theories are needed to account for the complex evolving processes that are shaped by actors facing a mixture of problems that require simultaneous, rather than sequential, attention.
Overall, the results in this paper showed that any analysis of the capacity of a governance subsystem in a HRSES to solve common-pool resource management problems must take into account not only the types of structures that exist in communication networks, but also the types of actors that partake in them and their predisposition to work jointly with others. Certain network configurations may indeed be necessary to improve how CPRs are used, but they are unlikely to be sufficient to achieve that goal in the absence of widespread participation by the whole gamut of actors that are active in the governance subsystem. Improving the management of common-pool resources in HRSES thus requires bonding, bridging, but also (and perhaps mainly) a fully-connected network where governmental actors adopt a very active role in the exchange of relevant information.
This article is not without limitations. Even though I provide a plausible explanation of the emergence of informal networks that facilitate information flows and adaptive governance (Folke et al. 2005, 459), there are factors – both endogenous and exogenous – that may affect network formation and evolution, but which have not been accounted for in this work. Among the former, for example, are the nuanced motivations of actors for building ties. Actors may choose to build ties because they want to garner technical information that they can use in policy-making processes, because they need to learn about the intricacies of overlapping regulations that may affect the management practices in which they are engaged, etc. Future research must not only identify the flows of information between actors in the networks, but also explicitly determine what the information is collected for. This will help fill the blanks in more comprehensive explanations of the motivations of actors when building their ties, which remains incomplete.
There are exogenous factors to consider as well. For example, not all networks will respond the same way to external shocks in the form of environmental crises that can affect how actors engage each other. Behavior inside the network is likely to be conditional on the institutional architecture in which the networks are embedded (Lubell et al. 2012), and on variables such as the political culture that predominates among its members. Additionally, even though single case studies can be used to test the plausibility of theories, they are not overly helpful in developing those theories because their results can be rarely generalized.
Future research needs to advance more decisively upon the weaknesses of this study, and produce further empirical evidence on the relationship between risk and network evolution in more cases over longer periods of time. Only then will we be able to create a comprehensive explanation of how social and/or political interactions can help solve the problems of overuse of common-pool resources in complex Social-Ecological systems.
I thank Tomas Olivier and Marcos Meyer for able research assistance in the collection of part of the data used in this paper. I also thank Ana Cingolani, Marcela Fernandez, Mark Lubell, and three anonymous reviewers for valuable comments that improved previous versions of this article. The usual caveats apply.
Agranoff and McGuire 2003. |
Agranoff, R., and M. McGuire. 2003. Collaborative Public Management: New Strategies for Local Governments. Washington DC: Georgetown University Press. |
Anderies et al. 2004. |
Anderies, J. M., M. A. Janssen, and E. Ostrom. 2004. A Framework to Analyze the Robustness of Social-ecological Systems from an Institutional Perspective. Ecology and Society 9(1):18. [online] URL: http://www.ecologyandsociety.org/vol9/iss1/art18. |
Amé et al. 2003. |
Amé, M. V., M. P. Díaz, and D. A. Wunderlin. 2003. Occurrence of Toxic Cyanobacterial Blooms in San Roque Reservoirs (Córdoba, Argentina): A Field and Chemometric Study. Environmental Toxicology 18:192-201. |
Axelrod 1984. |
Axelrod, R. 1984. The Evolution of Cooperation. New York: Basic Books. |
Berardo and Scholz 2010. |
Berardo, R., and J. T. Scholz. 2010. Self-Organizing Policy Networks: Risk, Partner Selection and Cooperation in Estuaries. American Journal of Political Science 54(3):632-649. |
Borgatti et al. 2002. |
Borgatti, S. P., M. G. Everett, and L. C. Freeman. 2002. Ucinet for Windows: Software for Social Network Analysis. Harvard: Analytic Technologies. |
Bromiley and Cummings 1995. |
Bromiley, P., and L. L. Cummings. 1995. Transactions Costs in Organizations with Trust. In Research on Negotiations in Organizations, eds. R. Bies, B. Sheppard and B. Lewicki, 219-250. Greenwich, CT: JAI Press. |
Burt 2005. |
Burt, R. S. 2005. Brokerage and Closure. An Introduction to Social Capital. Oxford: Oxford University Press. |
Catalini and García 2010. |
Catalini, C. G., and C. M. García. 2010. Analisis Estadistico Descriptivo Sobre Series Hidrologicas Historicas del Embalse San Roque (Periodo 1947-2009). Available online at: http://www.ucc.edu.ar/portalucc/archivos/File/Ingenieria/Grupos_Investigacion/EHCPA/2010/analisisserieshidrologicasembalsesanroque.pdf. Last accessed February 15th, 2014. |
Cingolani et al. 2008. |
Cingolani, A. M., D. Renison, P. A. Tecco, D. E. Gurvich, and M. Cabido. 2008. Predicting Cover Types in a Mountain Range with Long Evolutionary Grazing History: A GIS Approach. Journal of Biogeography 35:538-551. |
Coleman 1988. |
Coleman, J. S. 1988. Social Capital in the Creation of Human Capital. The American Journal of Sociology 94:S95-S120. |
El Diario de Carlos Paz 2011. |
2011. El Diario de Carlos Paz. Villa Carlos Paz: Intervención de la Nación por el acueducto a TierrAlta. |
Feiock 2009. |
Feiock, R. C. 2009. Metropolitan Governance and Institutional Collective Action. Urban Affairs Review 44(3):356-377. |
Feiock 2013. |
Feiock, R. C. 2013. The Institutional Collective Action Framework. Policy Studies Journal 41(3):397-425. |
Feiock and Scholz 2010. |
Feiock, R. C. and J. T. Scholz, eds. 2010. Self-organizing Governance: Collaborative Mechanisms to Mitigate Institutional Collective Action Dilemmas. NY: Cambridge University Press. |
Folke et al. 2005. |
Folke, C., T. Hahn, P. Olsson, and J. Norberg. 2005. Adaptive Governance of Social-Ecological Systems. Annual Review of Environmental Resources 30:441-473. |
Granovetter 1985. |
Granovetter, M. 1985. Economic Action and Social Structure: The Problem of Embeddedness. American Journal of Sociology 91(3):481-510. |
Huisman 2009. |
Huisman, M. 2009. Imputation of Missing Network Data: Some Simple Procedures. Journal of Social Structure 10(1):1-29. |
La Voz del Interior 2010. |
La Voz del Interior. 2010. La cantidad de algas es 100 veces mayor que la normal (printed November 24th, 2011).
|
La Voz del Interior 2011. |
La Voz del Interior. 2011. El San Roque huele mal y los peces sienten el impacto de las algas (printed April 6th, 2011).
|
Lubell et al 2012. |
Lubell, M., J. T. Scholz, R. Berardo, and G. Robins. 2012. Testing policy theory with statistical models of networks. Policy Studies Journal 40(3):351-374. |
Lubell 2013. |
Lubell, M. 2013. Governing Institutional Complexity: The Ecology of Games Framework. Policy Studies Journal 41(3):537-559. |
Ostrom 2005. |
Ostrom, E. 2005. Understanding Institutional Diversity. Princeton, NJ: Princeton University Press. |
Ostrom 2009. |
Ostrom, E. 2009. A General Framework for Analyzing Sustainability of Social-Ecological Systems. Science 325(5939):419-422. |
Putnam 1993. |
Putnam, R. 1993. Making Democracy Work. Princeton, NJ: Princeton University Press. |
Ripley et al. 2011. |
Ripley, R. M., T. A. B. Snijders, and P. Preciado. 2011. Manual for SIENA version 4.0 (version June 18, 2013). Oxford: University of Oxford, Department of Statistics; Nueld College. http://www.stats.ox.ac.uk/siena/. |
Ruibal Conti et al. 2005. |
Ruibal Conti, A. L., J. M. Guerrero, and J. M. Regueira. 2005. Levels
of Microcystins in Two Argentinean Reservoirs Used for Water Supply and
Recreation: Differences in the Implementation of Safe Levels. Environmental Toxicoloxy 20:263-269. |
Ruiz et al. 2013. |
Ruiz, M., L. Galanti, A. L. Ruibal, M. I. Rodríguez, D. A. Wunderlin, and M. V. Amé. 2013. First Report of Microcystins and Anatoxin-a Co-occurrence in San Roque Reservoirs (Córdoba, Argentina). Water, Air, & Soil Pollution 224:1593. DOI 10.1007/s11270-013-1593-2. |
Sabatier et al. 2005. |
Sabatier, P. A., W. D. Leach, M. Lubell , and N. W. Pelkey. 2005. Theoretical Frameworks Explaining Partnership Success. In Swimming Upstream. Collaborative Approaches to Watershed Management, eds. P. A. Sabatier, W. Focht, M. Lubell, Z. Trachtenberg, A. Vedlitz and M. Matlock, 173-199. Cambridge, MA: MIT Press. |
Schneider et al. 2003. |
Schneider, M., J. Scholz, M. Lubell, D. Mindruta, and M. Edwardsen. 2003. Building Consensual Institutions: Networks and the National Estuary Program. American Journal of Political Science 47:143-158. |
Scholz, J., R. Berardo and B. Kile 2008. |
Scholz, J., R. Berardo, and B. Kile. 2008. Do Networks Enhance Cooperation? Credibility, Search, and Collaboration. Journal of Politics 70(2):393-406. |
Schweinberger 2012. |
Schweinberger, M. 2012. Statistical Modeling of Network Panel Data: Goodness-of-fit. British Journal of Statistical and Mathematical Psychology 65:263-281. |
Snijders et al. 2010. |
Snijders, T. A. B., G. G. van de Bunt, and C. E. G. Steglich. 2010. Introduction to Stochastic Actor-based Models for Network Dynamics. Social Networks 32:44-60. |
Steglich et al. 2010. |
Steglich, C., T. A. B. Snijders, and M. Pearson. 2010. Dynamic Networks and Behavior: Separating Selection from Influence. Sociological Methodology 40:329-392. |
Wondolleck and Yaffee 2000. |
Wondolleck, J. M., and S. L. Yaffee. 2000. Making Collaboration Work: Lessons from Innovation in Natural Resource Management. Washington, DC: Island Press. |
Descriptive statistics.
| 1 | One of the questions in the survey asked “in general, when you get involved in discussions or activities related to the management of natural resources in the basin, do you do it as an individual, or do you represent an organization?” Given that the majority of respondents claimed to act in representation of an organization rather than individually, I aggregated responses of the individuals who claimed to represent the same organization. The aggregation was performed for both the links reported, and for the calculation of the nodal attributes. To measure links in the network I adopted the simple rule that any mention by one member of the organization of a link to other node counted as a tie. So, if at least one respondent working for organization A named organization B as a contact, then it was assumed that the tie between the two nodes existed (values larger than 1 were converted to 1 in order to keep the adjacency matrix dichotomous – the examination of the existence of configurations described in the hypotheses does not require valued links). |
| 2 | Image produced with Netdraw, available in UCINet (Borgatti et al. 2002). |
| 3 |
SIENA (the software used to estimate the models in this article) centers values for variables measured on interval scales. For each node, this is done by taking its score for the variable and then subtracting from it the mean value scored by all nodes in the network. Descriptive statistics for this variable and the other nodal attributes are contained in Table A1 in the Appendix. In cases of organizations with more than one respondent, I calculated the mean responses to assign values for attributes to the organization. Finally, for nodes in the network with missing data, I imputed data using conditional mean values by organizational type. For instance, if the organization that had missing data is an environmental NGO, then I assigned it attributes values equal to the mean values obtained from other environmental NGOs that are part of the network. |
| 4 | Berardo and Scholz included a third attribute in their model, a 7-point scale measuring the respondent’s self-reported orientation as pro-environmental (value of 1) or pro-development (value of 7). Their main goal was to model whether the likelihood of forming ties was conditioned on the similarity between ego and alter in this scale. I did not include this question in my surveys in the San Antonio river basin, and so I cannot include it in my model. Berardo and Scholz did not find any of the three effects associated with this variable to be significant at the 0.05 level. |
| 5 | A “score-type test” consists in estimating a model with certain parameters restricted to a value of 0, and checking whether the goodness-of-fit of the model would be improved by “freeing” those fixed parameters. In this case, model I was estimated with the new parameters in model II as restricted parameters. Results showed that the inclusion of the restricted parameters would improve the performance of the model, and so I include them in model II (see Schweinberger 2012 for more details). Results are available online at https://pantherfile.uwm.edu/berardo/www/research.htm. |
| 6 | Another way of quantifying change in the network is through the Jaccard index. It divides the number of ties present in the two observation points by the sum of the ties present in both observation points plus the number of new ties and the number of ties that have been terminated between the two periods. Values of <0.2 would lead to questioning the assumption that the change process is gradual, and hence would discourage the use of the type of model that is estimated in this paper (Snijders et al. 2010). The value of the Jaccard index in this study is 0.23 (see Table A1 in the Appendix), while in the Berardo and Scholz study it climbed to 0.26. The lower value of the coefficient in the San Antonio river basin indicates higher turnover in the network, which goes in hand with the observed higher rate of change mentioned above. |
| 7 | The “open 2-path” effect linked to hypothesis 3 was removed from the results table in Berardo and Scholz (2010) and is also removed here to preserve comparability with the original model as much as possible. The effect is highly correlated with the transitivity effect, which increases the standard errors and consequently drops the statistical significance of both effects. In the case of the San Antonio river basin, the transitivity coefficient is statistically significant only at the 0.1 level if the “open 2-path” is added into the model, with the latter being negative as predicted, but statistically insignificant at 0.1 level or lower (the effect becomes significant at 0.01 level if the transitivity effect is removed, which goes in line with hypothesis 3). Regardless of this statistical issue, it bears noticing that the negative coefficient for open 2-paths and the positive effect of transitive triads when included together imply that the former structures in the network tend to be embedded in the latter. Altogether, this indicates that in the HRSES of the San Antonio river basin there is in fact more bonding network capital, which the specialized literature identifies as an enabler of sustained collaboration in the network. |