Matlab/Octave demo - Bayesian Nonparametric (mixture of) Plackett-Luce for ranking data
This Matlab/Octave script provides a demo on the Bayesian nonparametric Plackett-Luce model described in (Caron et al., 2014), for analysing partial ranking data consisting of ordered lists of top-m items among a very large, potentially unbounded set of objects. This demo is in three parts:
- The first part reproduces some figures of the paper
- The second part samples from the nonparametric Plackett-Luce model and runs a MCMC sampler to estimate the weights associated to items and other parameters of the model
- The third part samples from the nonparametric mixture of Plackett-Luce model and runs a MCMC sampler to estimate the clustering of the lists, weights associated to items within each cluster and other parameters of the model
F. Caron, Y.W. Teh, T.B. Murphy. Bayesian nonparametric Plackett-Luce models for the analysis of preferences for college degree programmes. The Annals of Applied Statistics, vol. 8, no2, 1145-1181, 2014. Download paper.
Tested on Matlab 2014a with Statistics toolbox and on Octave 3.6.4.
Contents
Download and Installation
- Download the zip file containing the .m files
- Unzip the archive in some folder
- Add the folder to the Matlab/Octave path
mfiles_path = '.\'; % Indicate the path to the folder
addpath(mfiles_path); % Add to the Matlab/Octave path
Check if running Octave or Matlab
close all
clear all
set(0, 'defaultaxesfontsize', 14)
isoctave = (exist('OCTAVE_VERSION')~=0); % Checks if octave running
if ~isoctave
    rng('default');
else
    rand ('state', 'reset');
end
Contents
if ~isoctave
    help bnppl
end
Contents of bnppl:

cluster_est_binder             - gets a point estimate of the partition using Binder loss function
coclustering                   - computes the coclustering, or similarity matrix
demo_nppl                      - Matlab/Octave demo - Bayesian Nonparametric (mixture of) Plackett-Luce for ranking data
mcmc_mixnppl                   - runs a MCMC algorithm for the mixture of nonparametric Plackett-Luce model
mcmc_nppl                      - runs a MCMC algorithm for the nonparametric Plackett-Luce model
sample_mixnppl                 - samples from the nonparametric mixture of Plackett-Luce model
sample_nppl                    - samples from the nonparametric Plackett-Luce model
Reproduce some figures in the paper
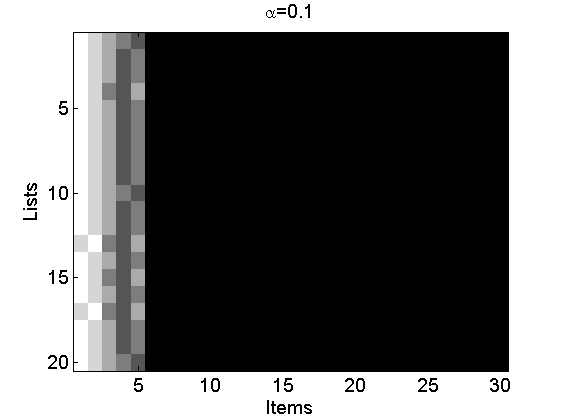
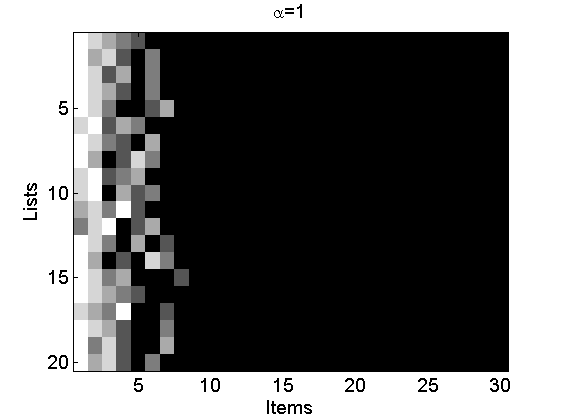
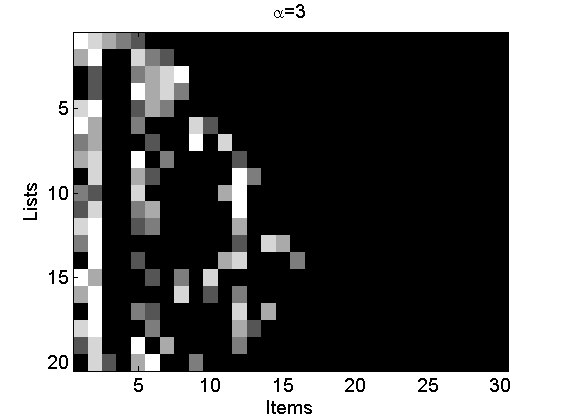
Reproduce Figures 2(a-c)
alpha = [0.1, 1, 3];
L = 20;
m = 5;
for i=1:3
    [~, ~, rho_inv] = sample_nppl(alpha(i), L, m);
    rho_inv(:,end+1:30)=NaN;
    figure
    rho_inv(isnan(rho_inv))=m+2;
    imagesc(rho_inv)
    cmap = colormap('gray');
    colormap(flipud(cmap));
    ylabel('Lists')
    xlabel('Items')
    title(['\alpha=' num2str(alpha(i))]);
end
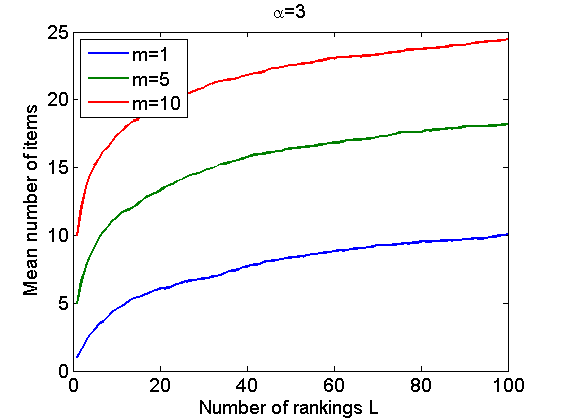
Reproduce Figures 3(a-b)
% Figure 3(a)
nsamples = 50;
L = 100;
m = 5;
alpha = [1, 5, 10];
vect = zeros(L,3);
for i=1:nsamples
    for j=1:3
        [~, ~, rho_inv] = sample_nppl(alpha(j), L, m, 1, 500);
        vect(:,j) = vect(:,j) + sum(cumsum(~isnan(rho_inv))>0,2)/nsamples;
    end
end
figure
plot(vect)
xlabel('Number of rankings L')
ylabel('Mean number of items')
legend({'\alpha=1','\alpha=5','\alpha=10'}, 'location', 'northwest')
title('m=5')

% Figure 3(b)
nsamples = 50;
L = 100;
m = [1,5,10];
alpha = 3;
vect = zeros(L,3);
for i=1:nsamples
    for j=1:3
        [~, ~, rho_inv] = sample_nppl(alpha, L, m(j), 1, 500);
        vect(:,j) = vect(:,j) + sum(cumsum(~isnan(rho_inv))>0,2)/nsamples;
    end
end
figure
plot(vect)
legend({'m=1','m=5','m=10'}, 'location', 'northwest')
xlabel('Number of rankings L')
ylabel('Mean number of items')
title('\alpha=3')

Bayesian Inference in Nonparametric Plackett-Luce
Sample data
alpha = 3; % Shape parameter of the Gamma Process - tunes the variability of the weights
L = 20; % Number of lists
m = 5; % Number of items ranked per list
[X, ~, rho_inv, wtrue, wtrue_star] = sample_nppl(alpha, L, m);
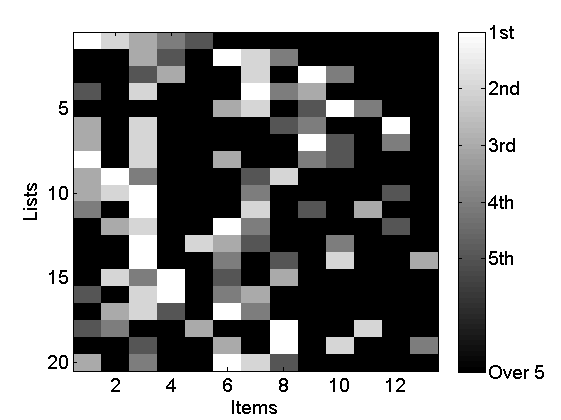
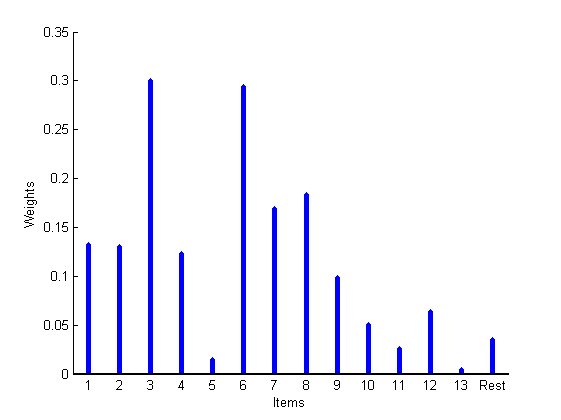
Plot data
% Plot lists
rho_plot = rho_inv;
rho_plot(isnan(rho_plot)) = m+2;
figure
imagesc(rho_plot)
cmap = colormap('gray');
colormap(flipud(cmap));
ylabel('Lists')
xlabel('Items')
colorbarlabel={'1st','2nd','3rd','4th','5th','6th', '7th', '8th' '9th', '10th'};
colorbarlabel{1}='1st';
colorbar('YDir', 'Reverse', 'Ytick', [1:m, m+2],'YTickLabel',...
    [colorbarlabel(1:5),{['Over ' num2str(m)]}]);

% Plot weights
K = max(X(:,1));
boxlabels = cell(K+1,1);
for i=1:K
    boxlabels{i}=num2str(i);
end
boxlabels{end} = 'Rest';
figure
stem([wtrue; wtrue_star], 'markersize', 0, 'linewidth', 4);
xlim([.5,K+1.5])
box off
set(gca, 'XTick', 1:K+1, 'XTickLabel', boxlabels, 'fontsize',10)
xlabel('Items')
ylabel('Weights')
Set parameters of the model and algorithm
param.gamma.init = 10; param.gamma.estimate = true; param.gamma.hyper = [.01,.01];
param.algo.niter = 20000; param.algo.nburn = param.algo.niter/2; param.algo.thin = 5;
Run MCMC to estimate the parameters
[w_st, pi_st, alpha_st] = mcmc_nppl(X, param);
-----------------------------------------------------
START MCMC for nonparametric Plackett-Luce
-----------------------------------------------------
niter = 20000 MCMC iterations
L = 20 lists
K = 13 items
mean(m) = 5 mean number of items ranked per list
-----------------------------------------------------
Estimated computation time: 1 minutes
-----------------------------------------------------
END MCMC for nonparametric Plackett-Luce
-----------------------------------------------------
Computation time: 0 minutes
-----------------------------------------------------
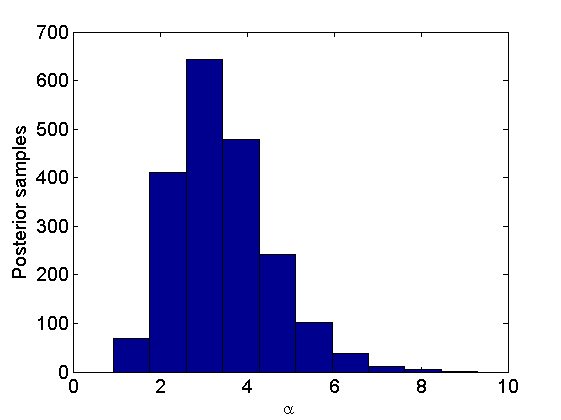
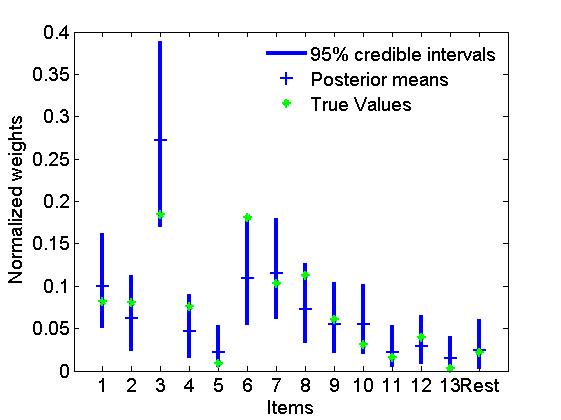
Plot posterior distributions of the weights and parameters
% Posterior for alpha
figure
hist(alpha_st)
xlabel('\alpha');
ylabel('Posterior samples');

% Posterior for the weights
figure
quants = quantile(pi_st',[.025,.975]);
h = plot([1:K+1;1:K+1], quants, 'b', 'linewidth',3);
hold on
h2 = plot(mean(pi_st,2), '+', 'markersize', 10);
h3 = plot([wtrue; wtrue_star]/sum([wtrue; wtrue_star]), '*g');
xlabel('Items')
ylabel('Normalized weights')
set(gca, 'xtick', 1:K+1, 'xticklabel', boxlabels)
legend([h(1) h2 h3],{'95% credible intervals','Posterior means','True Values'}); legend boxoff
Bayesian Inference in Nonparametric mixture of Plackett-Luce
Sample data
alpha = 5; % Shape parameter of the Gamma Process - tunes the variability of the weights
gamma = 3; % Parameter of the Dirichlet Process - tunes the number of clusters
phi = 10; % Correlation parameter - tunes the correlation between weights in different clusters
L = 500; % Number of lists
m = 10; % Number of items ranked per list
[X, rho, rho_inv, c, w0, w0_star, w, w_star] = sample_mixnppl(alpha, gamma, phi, L, m); % Sample data
K = max(X(:,1)); % Total number of items appearing in the top-m lists
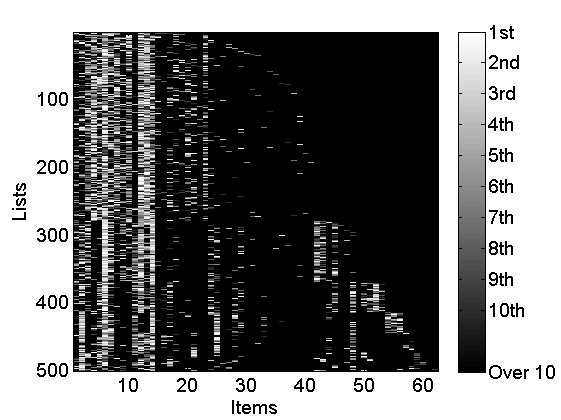
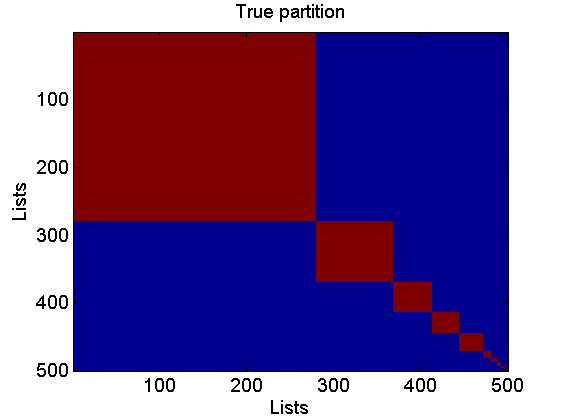
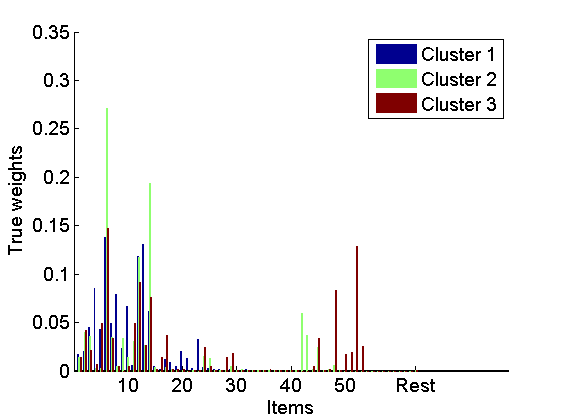
Plot data and true parameters values
% Plot lists
figure
rho_plot = rho_inv;
rho_plot(isnan(rho_plot)) = m+2;
imagesc(rho_plot)
cmap = colormap('gray');
colormap(flipud(cmap));
ylabel('Lists')
xlabel('Items')
colorbarlabel={'1st','2nd','3rd','4th','5th','6th', '7th', '8th' '9th', '10th'};
colorbar('YDir', 'Reverse', 'Ytick', [1:m, m+2],'YTickLabel',...
    [colorbarlabel(1:10),{['Over ' num2str(m)]}]);

% Plot true coclustering matrix
coclust_true = double(repmat(c, 1,L)==repmat(c',L,1));
figure
imagesc(coclust_true)
xlabel('Lists')
ylabel('Lists')
title('True partition')

% Plot normalized weights for the top three clusters
w_norm = bsxfun(@times,[w(:,1:3);w_star(1:3)],1./sum([w(:,1:3);w_star(1:3)], 1));
figure
bar(w_norm, 'EdgeColor', 'none')
box off
labels = {};
j=1;
for i=10:10:K-5
    labels{j}=num2str(i);
    j = j+1;
end
labels{end+1}='Rest';
set(gca, 'XTick', [10:10:K-5, K+1], 'XTickLabel', labels)
legend({'Cluster 1', 'Cluster 2', 'Cluster 3'})
xlabel('Items')
ylabel('True weights')
Set parameters of the model and algorithm
param.c.init = []; param.c.estimate = true;% Partition
param.alpha.estimate = true; param.alpha.init = 30; param.alpha.a = .01; param.alpha.b= .01;% Scale parameter of Gamma Process
param.gamma.estimate = true; param.gamma.init = 30; param.gamma.a = .01; param.gamma.b = .01; % Scale parameter of DP
param.phi.estimate = true; param.phi.init = 1; param.phi.a = .01; param.phi.b= .01; % Correlation between rankings
param.algo.niter = 20000; param.algo.nburn = param.algo.niter/2; param.algo.thin = 5;% MCMC algorithm
Run MCMC algorithm
[~, ~, ~, ~, c_st] = mcmc_mixnppl(X, param);
-----------------------------------------------------
START MCMC for mixture of nonparametric Plackett-Luce
-----------------------------------------------------
niter = 20000 MCMC iterations
L = 500 lists
K = 62 items
mean(m) = 10 mean number of items ranked per list
-----------------------------------------------------
Estimated computation time: 27 minutes
-----------------------------------------------------
END MCMC for mixture of nonparametric Plackett-Luce
-----------------------------------------------------
Computation time: 6 minutes
-----------------------------------------------------
Plot summaries of the posterior
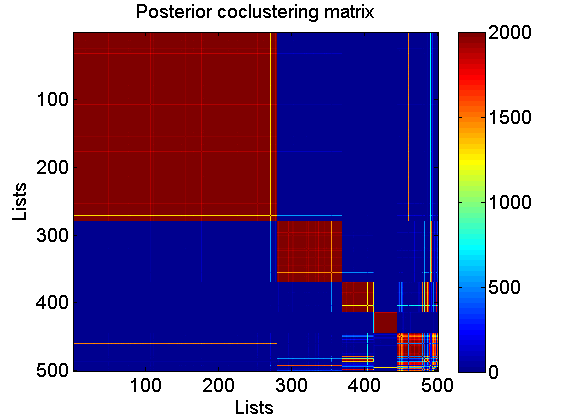
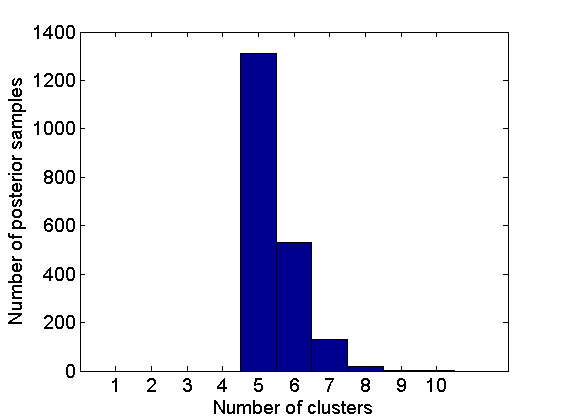
% Coclustering matrix
coclust = coclustering(c_st, 1, c);
figure
imagesc(coclust)
xlabel('Lists')
ylabel('Lists')
title('Posterior coclustering matrix')
colorbar

% Number of clusters
nb_clust = zeros(size(c_st,2), 1);
for i=1:size(c_st,2)
    nb_clust(i) = length(unique(c_st(:,i)));
end
figure
hist(nb_clust, 1:10)
xlabel('Number of clusters')
ylabel('Number of posterior samples')
Get a point estimate of the partition
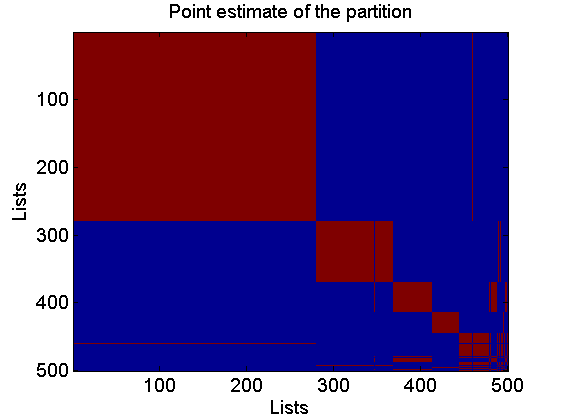
c_est = cluster_est_binder(c_st);

figure
coclust_est = double(repmat(c_est, 1,L)==repmat(c_est',L,1));
imagesc(coclust_est)
xlabel('Lists')
ylabel('Lists')
title('Point estimate of the partition')
Rerun MCMC given the point estimate of the partition to get posterior of the weights given the partition
param.c.init = c_est; param.c.estimate = false;% Partition
param.algo.niter = 2000; param.algo.nburn = param.algo.niter/2; param.algo.thin = 1;% MCMC algorithm

[w_st, w0_st, wnorm_st]  = mcmc_mixnppl(X, param);
-----------------------------------------------------
START MCMC for mixture of nonparametric Plackett-Luce
-----------------------------------------------------
niter = 2000 MCMC iterations
L = 500 lists
K = 62 items
mean(m) = 10 mean number of items ranked per list
-----------------------------------------------------
Estimated computation time: 0 minutes
-----------------------------------------------------
END MCMC for mixture of nonparametric Plackett-Luce
-----------------------------------------------------
Computation time: 0 minutes
-----------------------------------------------------
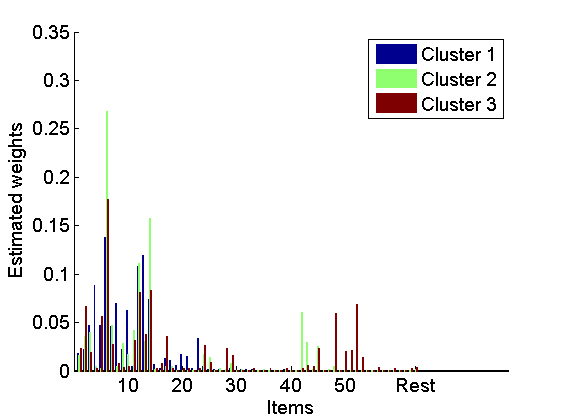
Plot mean estimates of the normalized weights in the 3 largest clusters
figure
bar(mean(wnorm_st(:,1:3, :),3), 'EdgeColor', 'none')
box off
labels = {};
j=1;
for i=10:10:K-5
    labels{j}=num2str(i);
    j = j+1;
end
labels{end+1}='Rest';
set(gca, 'XTick', [10:10:K-5, K+1], 'XTickLabel', labels)
legend({'Cluster 1', 'Cluster 2', 'Cluster 3'})
xlabel('Items')
ylabel('Estimated weights')